Smart Schedule
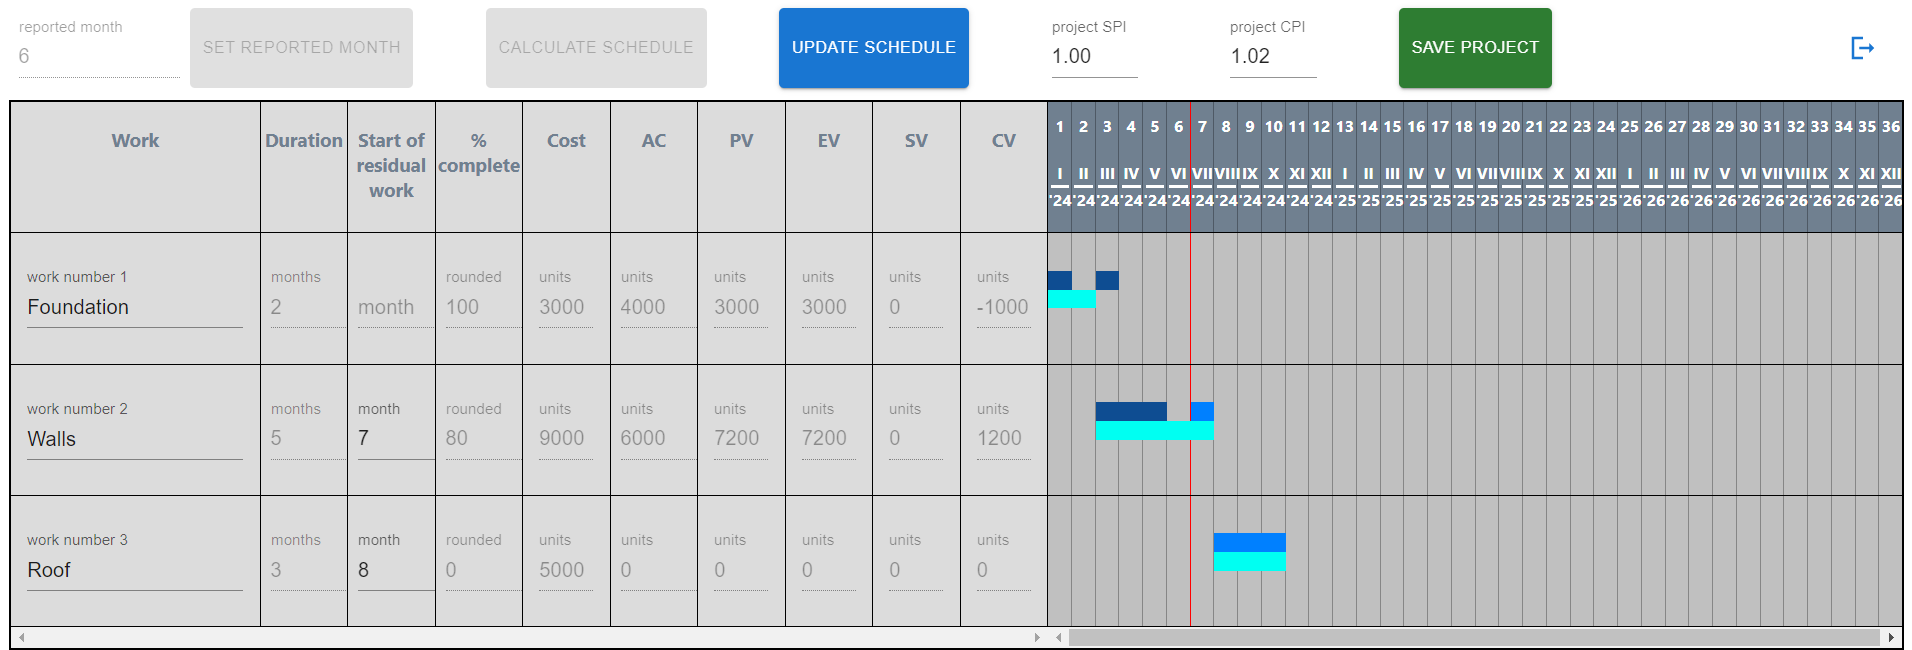
Gantt chart for tracking project progress: input % complete and actual cost, calculate schedule and get EVM indicators with S-curves. It is simpler than Excel.
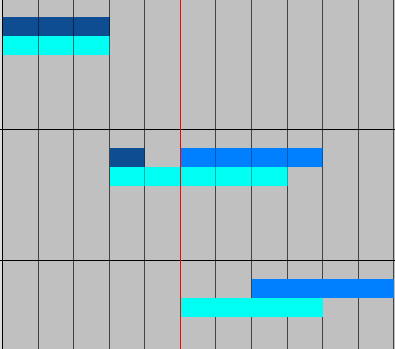
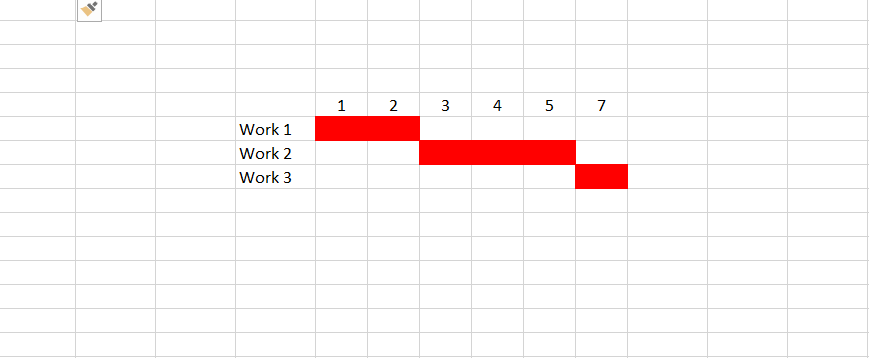
- Follows the rule: completed work parts in the past, uncompleted in the future
- Allows to manage residual work
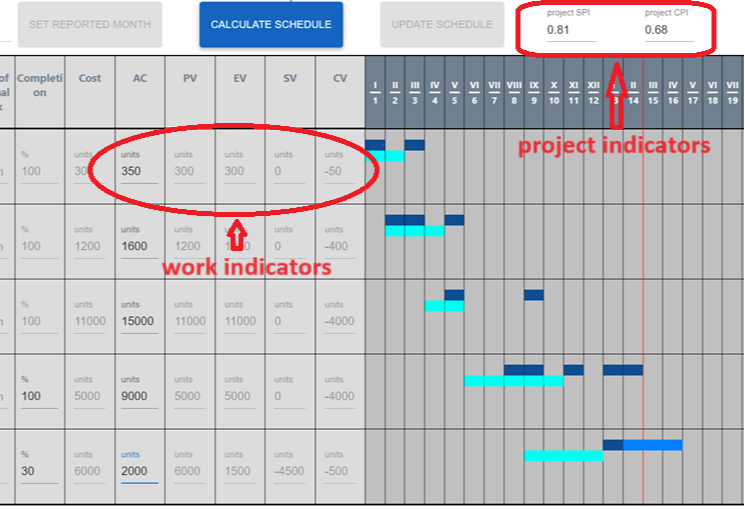
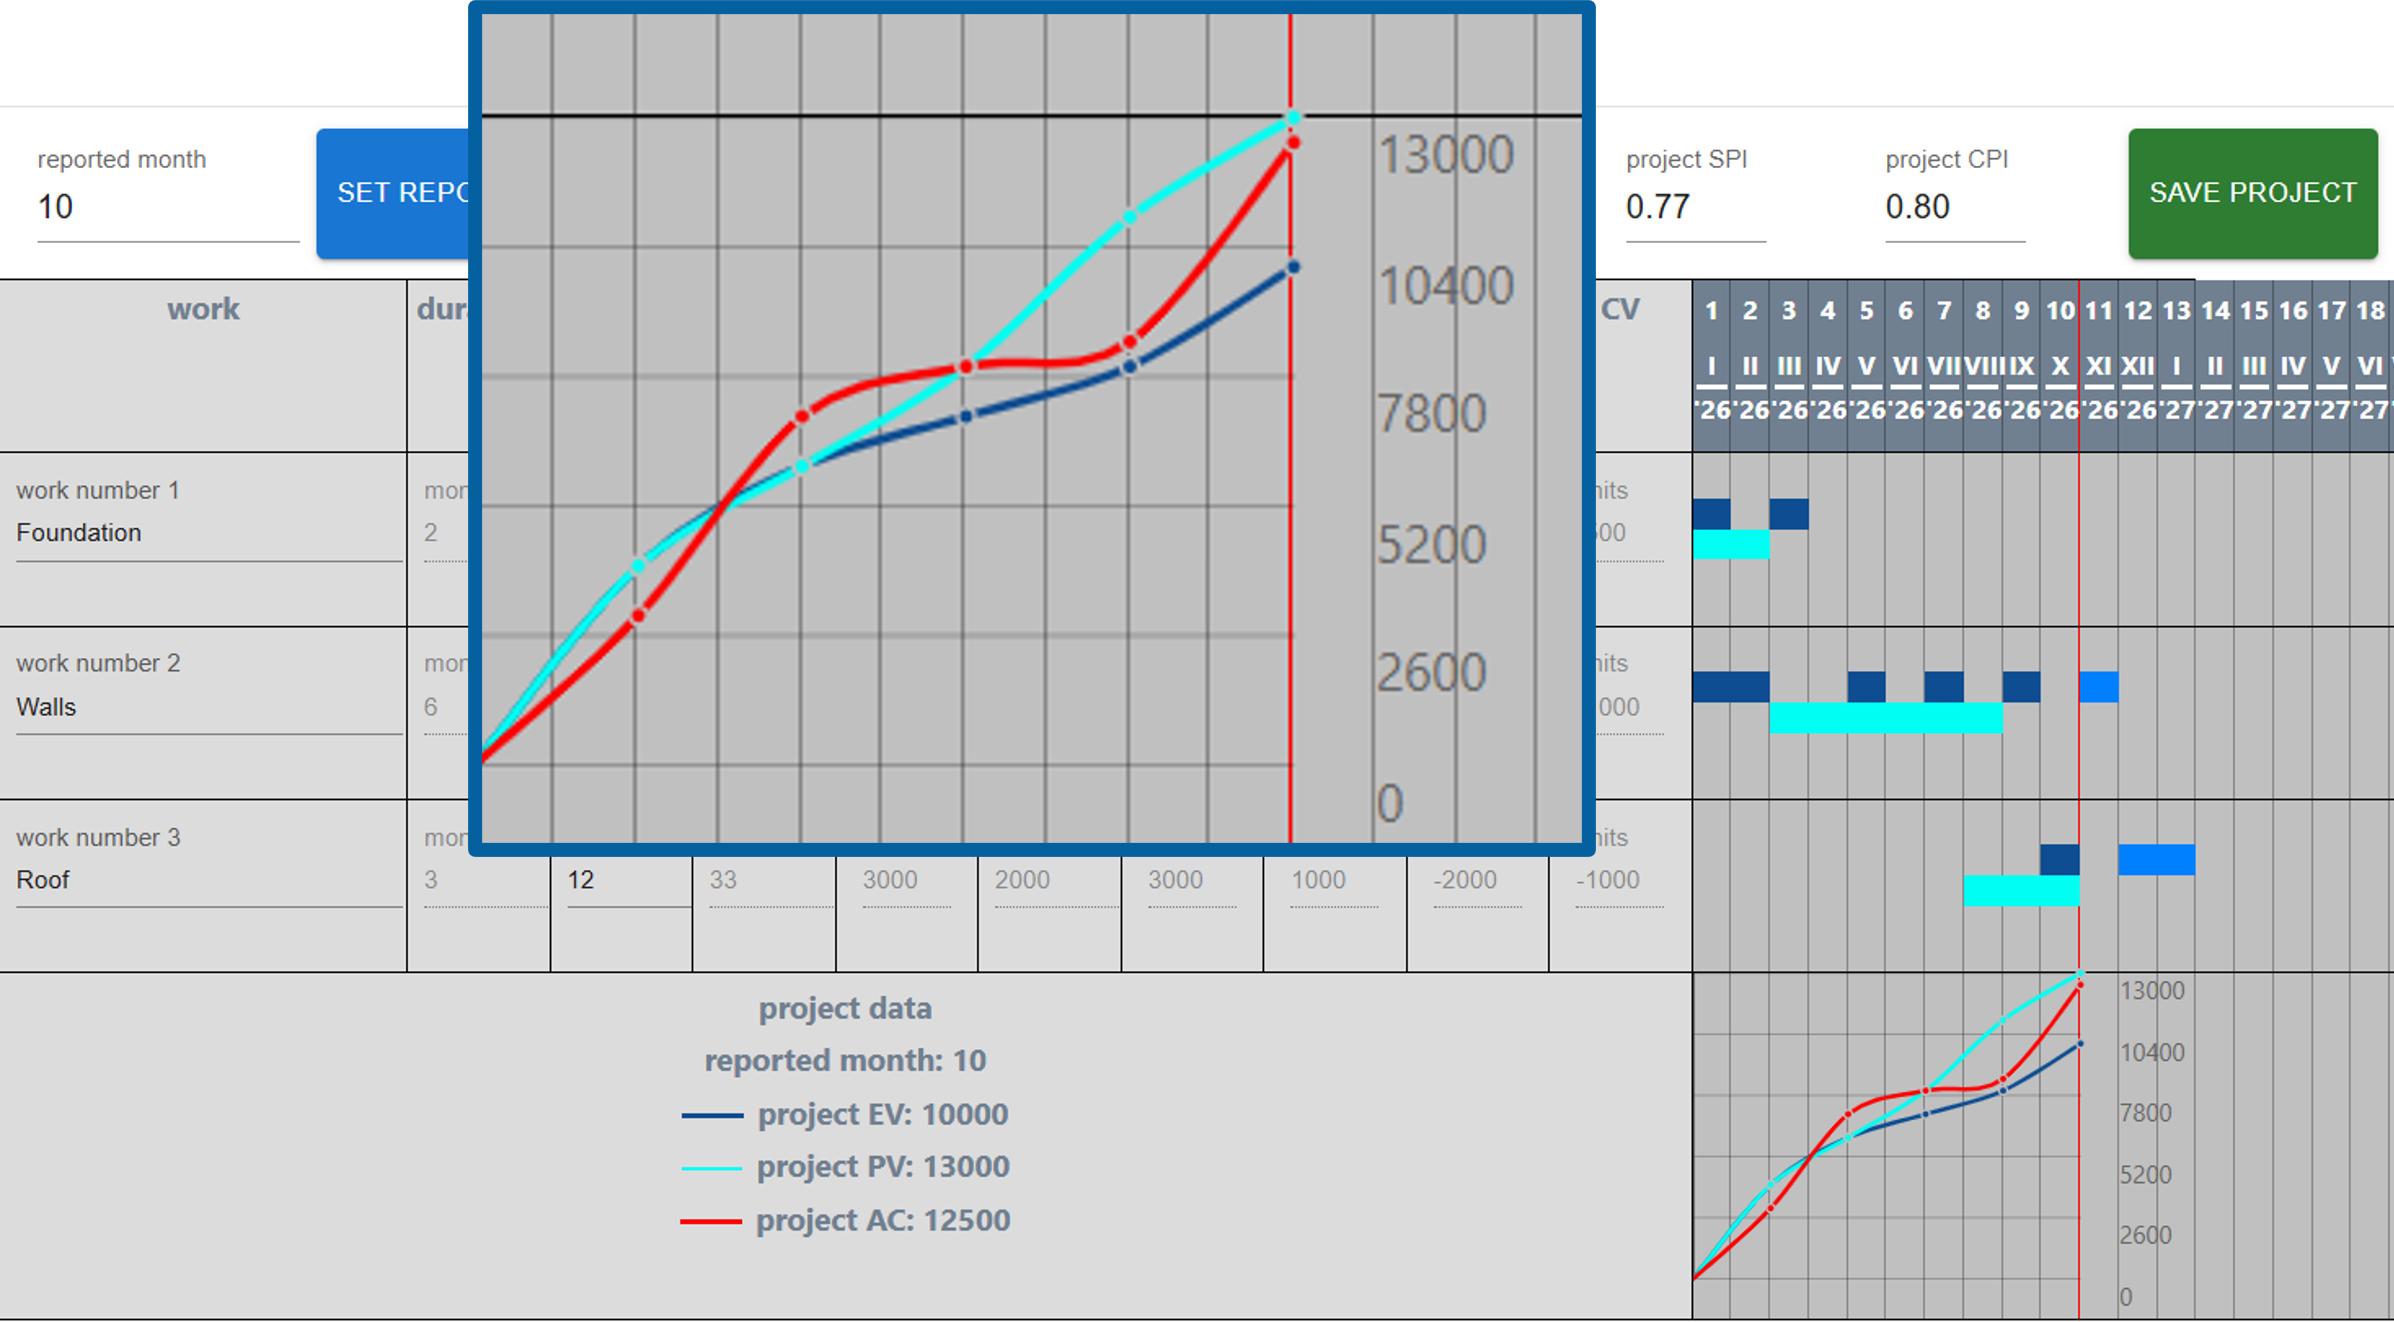
- Provides EVM indicators and S-curves easily
It is recommended to view app on screen 13" or bigger
Demonstration
How Smart Schedule calculates schedule and computes EVM indicators